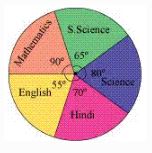
NCERT Solutions Class 8 Mathematics Data Handling Ex 5.2

Class 8 - Mathematics
Data Handling - Exercise 5.2

NCERT Solutions Class 8 mathematics textbook
Top Block 1
Question: 1. A survey was made to find the type of music that a certain group of young people liked in a city.

Adjoining pie chart shows the findings of this survey.

From this pie chart, answer the following:

(i) If 20 people liked classical music, how many young people were surveyed?
(ii) Which type of music is liked by the maximum number of people?
(iii) If a cassette company were to make 1000 CD’s, how many of each type would they make?

Answer :
(i) 10% represents 100 people.

Therefore 20% represents = (100×20)10

= 200 people

Hence, 200 people were surveyed.

(ii) Light music is liked by the maximum number of people.

(iii) CD’s of classical music = (10×1000)10

= 100

CD’s of semi-classical music = (20×1000)10 = 200

CD’s of light music = (40×1000)10 = 400

CD’s of folk music = (30×1000)10 = 300

Question: 2. A group of 360 people were asked to vote for their favourite season from the three seasons rainy, winter and summer.

(i) Which season got the most votes?

(ii) Find the central angle of each sector.

(iii) Draw a pie chart to show this information.

Season Number of votes
Summer 90
Rainy 120
Winter 150
Answer :
(i) Winter season got the most votes.

(ii) Central angle of summer season = (90° x 360°)360° = 90°

Central angle of rainy season

= (120° x 360°)360° = 120°

Central angle of winter season

= (150° x 360°)360° = 150°

Season Number of Votes In Fraction Central Angle
Summer 90 90360 90360 X 360° = 90°
Rainy 120 120360 120360 X 360° = 120°
Winter 150 150360 150360 X 360° = 150°
(iii)
NCERT Solutions Class 8 Mathematics Data Handling
Question:3. Draw a pie chart showing the following information. The table shows the colours preferred by a group of people.

Colours Number of People
Blue 18
Green 9
Red 6
Yellow 3
Total 36
Answer :
Here, central angle = 360° and total number of people = 36

Colours Colours Colours Number of People
Blue 18 1836 1836 X 360° = 180°
Green 9 936 936 X 360° = 90°
Red 6 636 636 X 360° = 60°
Yellow 3 336 336 X 360° = 30°
NCERT Solutions Class 8 Mathematics Data Handling
Mddle block 1
Question:4. The adjoining pie chart gives the marks scored in an examination by a student in Hindi, English, Mathematics, Social Science and Science. If the total marks obtained by the students were 540, answer the following questions:

NCERT Solutions Class 8 Mathematics Data Handling
(i) In which subject did the student score 105 marks?

(Hint: for 540 marks, the central angle = 360° So, for 105 marks, what is the central angle?)

(ii) How many more marks were obtained by the student in Mathematics than in Hindi?

(iii) Examine whether the sum of the marks obtained in Social Science and Mathematics is more than that in Science and Hindi.

(Hint: Just study the central angles)

Answer :
Subject Central Angle Marks obtained
Mathematics 90° 90°360° X 540 = 135
Social Science 65° 65°360° X 540 = 97.5
Science 80° 80°360° X 540 = 120
Hindi 70° 70°360° X 540 = 155
English 55° 55°360° X 540 = 82.5
(i) The student scored 105 marks in Hindi.

(ii) Marks obtained in Mathematics = 135

Marks obtained in Hindi = 105

Difference = 135 – 105 = 30

Thus, 30 more marks were obtained by the student in Mathematics than in Hindi.

(iii) The sum of marks in Social Science and Mathematics = 97.5 + 135 = 232.5

The sum of marks in Science and Hindi = 120 + 105 = 225

Yes, the sum of the marks in Social Science and Mathematics is more than that in Science and Hindi.

Question:5. The number of students in a hostel, speaking different languages is given below.

Display the data in a pie chart.
Language Hindi English Marathi Tamil Bengali Total
Number of Students 40 12 9 7 4 72
Answer :
Language Number of Students Number of Students
Hindi 40 4072 4072 X 360° = 200°
English 12 1272 1272 X 360° = 60°
Marathi 9 972 972 X 360° = 45°
Tamil 7 772 772 X 360° = 35°
Bengali 4 472 472 X 360° = 20°
NCERT Solutions Class 8 Mathematics Data Handling
Pie chart at above given data is as follows.
Bottom Block 3
Share with your friends

Leave a Reply