
Class 11 - Mathematics
Linear Inequalities - Exercise 6.3

Top Block 1
Question 1:
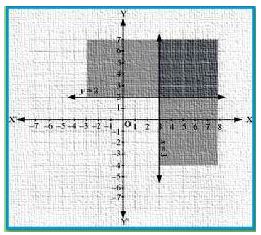
Solve the following system of inequalities graphically: x ≥ 3, y ≥ 2.
Answer:
x ≥ 3 ………….1
y ≥ 2 ………….2
The graph of the lines, x = 3 and y = 2, are drawn in the figure below.
Inequality 1 represents the region on the right hand side of the line,
x = 3 (including the line x = 3), and inequality 2 represents the region above the line, y = 2
(including the line y = 2).
Hence, the solution of the given system of linear inequalities is represented by the common
shaded region including the points on the respective lines as follows:
Question 2:
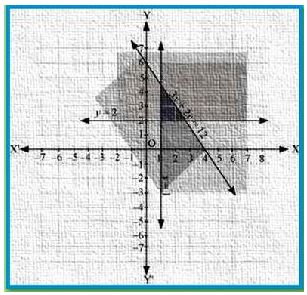
Solve the following system of inequalities graphically: 3x + 2y ≤ 12, x ≥ 1, y ≥ 2
Answer:
3x + 2y ≤ 12 …………..1
x ≥ 1 …………………….2
y ≥ 2 …………………….3
The graphs of the lines, 3x + 2y = 12, x = 1, and y = 2, are drawn in the figure below.
Inequality 1 represents the region below the line, 3x + 2y = 12 ( including the line 3x + 2y =
12). Inequality 2 represents the region on the right side of the line, x = 1 (including the line x =
1). Inequality 3 represents the region above the line, y = 2 (including the line y = 2).
Hence, the solution of the given system of linear inequalities is represented by the common
shaded region including the points on the respective lines as follows:
Mddle block 1
Question 3:
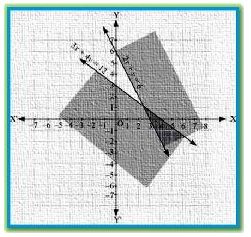
Solve the following system of inequalities graphically: 2x + y≥ 6, 3x + 4y ≤ 12
Answer:
2x + y≥ 6 …………..1
3x + 4y ≤ 12 ………..2
The graph of the lines, 2x + y= 6 and 3x + 4y = 12, are drawn in the figure below.
Inequality 1 represents the region above the line, 2x + y= 6 ( including the line 2x + y= 6), and
inequality 2 represents the region below the line, 3x + 4y =12 ( including the line 3x + 4y =12).
Hence, the solution of the given system of linear inequalities is represented by the common
shaded region including the points on the respective lines as follows:
Question 4:
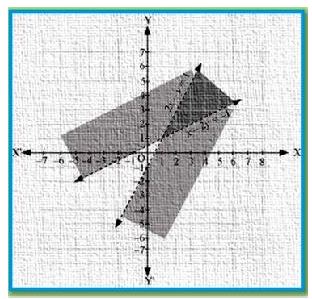
Solve the following system of inequalities graphically: x + y≥ 4, 2x – y > 0
Answer:
x + y≥ 4 …………….1
2x – y > 0 …………….2
The graph of the lines, x + y = 4 and 2x – y = 0, are drawn in the figure below.
Inequality 1 represents the region above the line, x + y = 4 (including the line x + y = 4). It is
observed that (1, 0) satisfies the inequality, 2x – y > 0. [2(1) – 0 = 2 > 0]
Therefore, inequality 2 represents the half plane corresponding to the line, 2x – y = 0,
containing the point (1, 0) [excluding the line 2x – y > 0].
Hence, the solution of the given system of linear inequalities is represented by the common
shaded region including the points on line x + y = 4 and excluding the points on line 2x – y = 0
as follows:

Question 5:
Solve the following system of inequalities graphically: 2x – y > 1, x – 2y < –1
Answer:
2x – y > 1 …………..1
x – 2y < –1 …………..2
The graph of the lines, 2x – y = 1 and x – 2y = –1, are drawn in the figure below.
Inequality 1 represents the region below the line, 2x – y = 1 (excluding the line 2x – y = 1), and
inequality 2 represents the region above the line, x – 2y = –1 (excluding the line x – 2y = –1).
Hence, the solution of the given system of linear inequalities is represented by the common
shaded region excluding the points on the respective lines as follows:
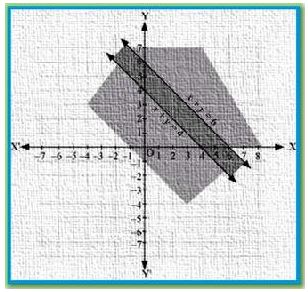
Question 6:
Solve the following system of inequalities graphically: x + y ≤ 6, x + y ≥ 4
Answer:
x + y ≤ 6 …………1
x + y ≥ 4 …………2
The graph of the lines, x + y = 6 and x + y = 4, are drawn in the figure below.
Inequality 1 represents the region below the line, x + y = 6 (including the line x + y = 6), and
inequality 2 represents the region above the line, x + y = 4 (including the line x + y = 4).
Hence, the solution of the given system of linear inequalities is represented by the common
shaded region including the points on the respective lines as follows:
Question 7:
Solve the following system of inequalities graphically: 2x + y≥ 8, x + 2y ≥ 10
Answer:
2x + y= 8 …………..1
x + 2y = 10 ………….2
The graph of the lines, 2x + y= 8 and x + 2y = 10, are drawn in the figure below.
Inequality 1 represents the region above the line, 2x + y = 8, and inequality 2 represents the
region above the line, x + 2y = 10.
Hence, the solution of the given system of linear inequalities is represented by the common
shaded region including the points on the respective lines as follows.

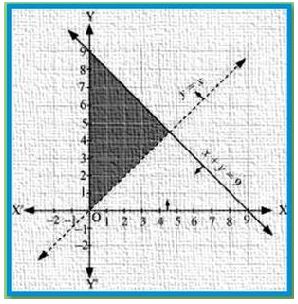
Question 8:
Solve the following system of inequalities graphically: x + y ≤ 9, y > x, x ≥ 0
Answer:
X + y ≤ 9 ………….1
y > x …………..2
x ≥ 0 …………..3
The graph of the lines, x + y= 9 and y = x, are drawn in the figure below.
Inequality 1 represents the region below the line, x + y = 9 (including the line x + y = 9). It is
observed that (0, 1) satisfies the inequality, y > x. [1 > 0].
Therefore, inequality 2 represents the half plane corresponding to the line, y = x, containing
the point (0, 1) [excluding the line y = x]. Inequality 3 represents the region on the right hand
side of the line, x = 0 or y-axis (including y-axis).
Hence, the solution of the given system of linear inequalities is represented by the common
shaded region including the points on the lines, x + y = 9 and x = 0, and excluding the points on
line y = x as follows:
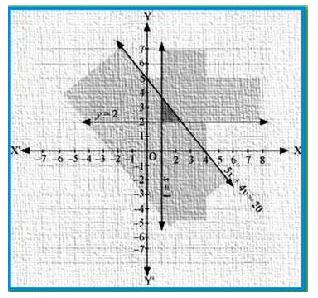
Question 9:
Solve the following system of inequalities graphically: 5x + 4y ≤ 20, x ≥ 1, y ≥ 2
Answer:
5x + 4y ≤ 20 …………….1
x ≥ 1 ……………..2
y ≥ 2 ……………..3
The graph of the lines, 5x + 4y = 20, x = 1, and y = 2, are drawn in the figure below.
Inequality 1 represents the region below the line, 5x + 4y = 20 (including the line 5x + 4y = 20).
Inequality 2 represents the region on the right hand side of the line, x = 1 (including the line x =
1). Inequality 3 represents the region above the line, y = 2 (including the line y = 2).
Hence, the solution of the given system of linear inequalities is represented by the common
shaded region including the points on the respective lines as follows:
Question 10:
Solve the following system of inequalities graphically: 3x + 4y ≤ 60, x + 3y ≤ 30, x ≥ 0, y ≥ 0
Answer:
3x + 4y ≤ 60 …………..1
x + 3y ≤ 30 …………..2
The graph of the lines, 3x + 4y = 60 and x + 3y = 30, are drawn in the figure below.
Inequality 1 represents the region below the line, 3x + 4y = 60 (including the line 3x + 4y = 60),
and inequality 1 represents the region below the line, x + 3y = 30 (including the line x + 3y =
30).
Since x ≥ 0 and y ≥ 0, every point in the common shaded region in the first quadrant including
the points on the respective line and the axes represents the solution of the given system of
linear inequalities.

Question 11:
Solve the following system of inequalities graphically: 2x + y≥ 4, x + y ≤ 3, 2x – 3y ≤ 6
Answer:
2x + y≥ 4 ………….1
x + y ≤ 3 ………….2
2x – 3y ≤ 6 …………3
The graph of the lines, 2x + y= 4, x + y = 3, and 2x – 3y = 6, are drawn in the figure below.
Inequality 1 represents the region above the line, 2x + y= 4 (including the line 2x + y = 4).
Inequality 2 represents the region below the line, x + y = 3 (including the line x + y = 3).
Inequality 3 represents the region above the line, 2x – 3y = 6 (including the line 2x – 3y = 6).
Hence, the solution of the given system of linear inequalities is represented by the common
shaded region including the points on the respective lines as follows:

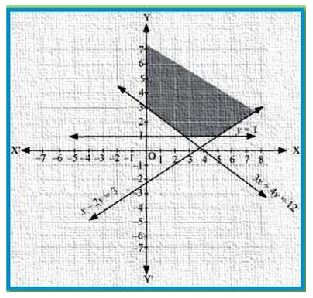
Question 12:
Solve the following system of inequalities graphically: x – 2y ≤ 3, 3x + 4y ≥ 12, x ≥ 0, y ≥ 1
Answer:
x – 2y ≤ 3 ………………….1
3x + 4y ≥ 12 ………………….2
y ≥ 1 ………………….3
The graph of the lines, x – 2y = 3, 3x + 4y = 12, and y = 1, are drawn in the figure below.
Inequality 1 represents the region above the line, x – 2y = 3 (including the line x – 2y = 3).
Inequality 2 represents the region above the line, 3x + 4y = 12 (including the line 3x + 4y = 12).
Inequality 3 represents the region above the line, y = 1 (including the line y = 1). The
inequality, x ≥ 0, represents the region on the right hand side of y-axis (including y – axis).
Hence, the solution of the given system of linear inequalities is represented by the common
shaded region including the points on the respective lines and y- axis as follows:
Question 13:
Solve the following system of inequalities graphically: 4x + 3y ≤ 60, y ≥ 2x, x ≥ 3, x, y ≥ 0
Answer:
4x + 3y ≤ 60 ………………1
y ≥ 2x ………………2
x ≥ 3 ………………3
The graph of the lines, 4x + 3y = 60, y = 2x, and x = 3, are drawn in the figure below.
Inequality 1 represents the region below the line, 4x + 3y = 60 (including the line 4x + 3y = 60).
Inequality 2 represents the region above the line, y = 2x (including the line y = 2x).
Inequality 3 represents the region on the right hand side of the line, x = 3 (including the line x =
3).
Hence, the solution of the given system of linear inequalities is represented by the common
shaded region including the points on the respective lines as follows:

Question 14:
Solve the following system of inequalities graphically:
3x + 2y ≤ 150, x + 4y ≤ 80, x ≤ 15, y ≥ 0, x ≥ 0
Answer:
3x + 2y ≤ 150 ……………1
x + 4y ≤ 80 ……………2
x ≤ 15 ……………3
The graph of the lines, 3x + 2y = 150, x + 4y = 80, and x = 15, are drawn in the figure below.
Inequality 1 represents the region below the line, 3x + 2y = 150 (including the line 3x + 2y =
150). Inequality 2 represents the region below the line, x + 4y = 80 (including the line x + 4y =
80). Inequality 3 represents the region on the left hand side of the line, x = 15 (including the
line x = 15).
Since x ≥ 0 and y ≥ 0, every point in the common shaded region in the first quadrant including
the points on the respective lines and the axes represents the solution of the given system of
linear inequalities.

Question 15:
Solve the following system of inequalities graphically:
x + 2y ≤ 10, x + y ≥ 1, x – y ≤ 0, x ≥ 0, y ≥ 0
Answer:
x + 2y ≤ 10 …………………1
x + y ≥ 1 ………………….2
x – y ≤ 0 …………………..3
The graph of the lines, x + 2y = 10, x + y = 1, and x – y = 0, are drawn in the figure below.
Inequality 1 represents the region below the line, x + 2y = 10 (including the line x + 2y = 10).
Inequality 2 represents the region above the line, x + y = 1 (including the line x + y = 1).
Inequality 3 represents the region above the line, x – y = 0 (including the line x – y = 0).
Since x ≥ 0 and y ≥ 0, every point in the common shaded region in the first quadrant including
the points on the respective lines and the axes represents the solution of the given system of
linear inequalities.

Bottom Block 3
Click here to visit Official CBSE website
Click here for NCERT solutions
Click here to visit Official Website of NCERT
Click here to download NCERT Textbooks
