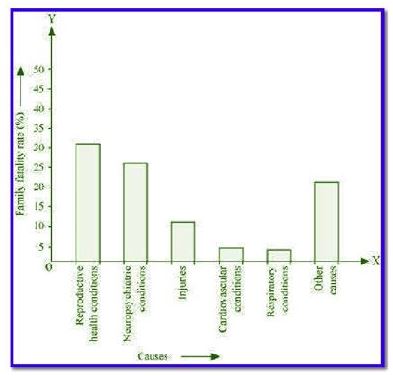
Question : 1 : A survey conducted by an organisation for the cause of illness and death among the women between the ages 15 – 44 (in years) worldwide, found the following figures (in %):
(i) Represent the information given above graphically.
(ii) Which condition is the major cause of women’s ill health and death worldwide?
(iii) Try to find out, with the help of your teacher, any two factors which play a major role in the cause in (ii) above being the major cause.
Answer :
(i) By representing cause on x-axis and family fatality rate on y-axis and choosing an appro-
priate scale (1 unit = 5% for y-axis), the graph of the information given above can be
Constructed as follows:
All the rectangle bars are of the same width and have equal spacing between them.
(ii) Reproductive health condition is the major cause of women’s ill health and dead world
wide as 31.8% of women are affected by it.
(iii) The factors are as follows:
Lack of medical facilities
Lack of correct knowledge of treatment.
Mddle block 1
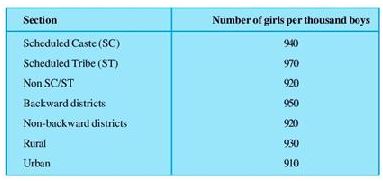
Question : 2: The following data on the number of girls (to the nearest ten) per thousand boys in different sections of Indian society is given below.
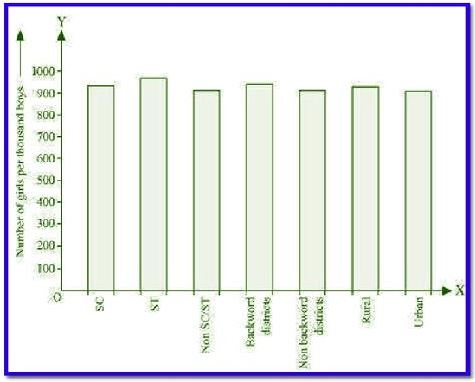
(i) Represent the information above by a bar graph.
(ii) In the classroom discuss what conclusions can be arrived at from the graph.
Answer :
(i) By representing section (variable) on x-axis and number of girls per thousand boys on y-axis,
the graph of the information given above can be constructed by choosing an appropriate scale
(1 unit = 100 girls for y-axis)
Here, all the rectangle bars are of the same length and have equal spacing in between them.
(ii) It can be observed that maximum number of girls per thousand boys (i.e., 970) is for ST and
minimum number of girls per thousand boys (i.e., 910) is for urban. Also, the number of girls
per thousand boys is greater in rural areas than that in urban areas, backward districts than
that in non-backward districts, SC and ST than that in non SC/ST.
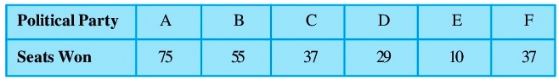
Question : 3: Given below are the seats won by different political parties in the polling outcome of a state assembly elections:
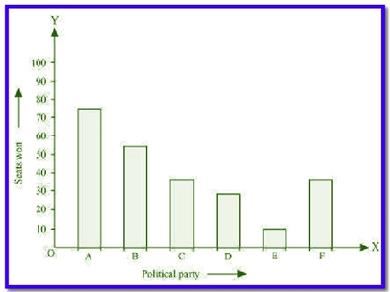
(i) Draw a bar graph to represent the polling results.
(ii)Which political party won the maximum number of seats?
Answer :
(i) By taking polling results on x-axis and seats won as y-axis and choosing an appropriate scale (1 unit = 10 seats for y-axis), the required graph
of the above information can be constructed as follows:
Here, the rectangle bars are of the same length and have equal spacing in between them.
(ii)Political party A won maximum number of seats.
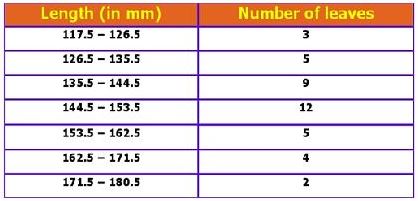
Question : 4: The length of 40 leaves of a plant are measured correct to one millimetre, and the obtained data is represented in the following table:
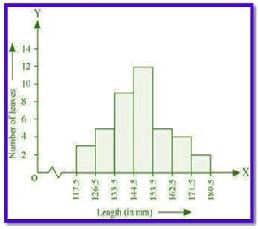
(i) Draw a histogram to represent the given data.
(ii) Is there any other suitable graphical representation for the same data?
(iii)Is it correct to conclude that the maximum numbers of leaves are 153 mm long? Why?
Answer :
(i) It can be observed that the length of leaves is represented in a discontinuous class interval having a difference of 1 in between them.
Therefore, 1/2 = 0.5 has to be added to each upper class limit and also have to subtract 0.5 from the lower class limits so as to make the class intervals continuous.
Taking the length of leaves on x-axis and the number of leaves on y-axis, the histogram of this
information can be drawn as above.
Here, 1 unit on y-axis represents 2 leaves.
(ii) Other suitable graphical representation of this data is frequency polygon.
(iii) No, as maximum number of leaves (i.e., 12) has their length in between 144.5 mm and
153.5 mm. It is not necessary that all have their lengths as 153 mm.
Question : 5: The following table gives the life times of neon lamps:
(i) Represent the given information with the help of a histogram.
(ii)How many lamps have a lifetime of more than 700 hours?
Answer :
(i) By taking life time (in hours) of neon lamps on x-axis and the number of lamps on y-axis, the histogram of the given information can be drawn as follows.
Here, 1 unit on y-axis represents 10 lamps.
(ii) It can be concluded that the number of neon lamps having their lifetime more than 700 is the sum of the number of neon lamps having their lifetime as
700 − 800, 800 − 900, and 900 – 1000.
Therefore, the number of neon lamps having their lifetime more than 700 hours is 184.(74 + 62 + 48 = 184)
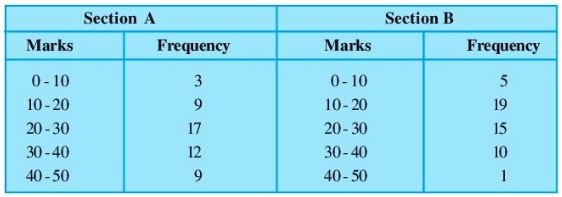
Question : 6: The following table gives the distribution of students of two sections according to the mark obtained by them:
Represent the marks of the students of both the sections on the same graph by two frequency polygons. From the two polygons compare the performance of the two sections.
Answer :
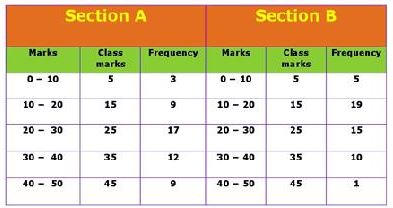
We can find the class marks of the given class intervals by using the following formula.
Class mark = (Upper class limit + Lower class limit)/2
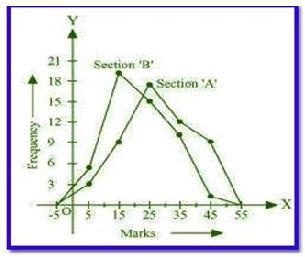
Taking class marks on x-axis and frequency on y-axis and choosing an appropriate scale (1 unit = 3 for y-axis), the frequency polygon can be drawn as follows.
It can be observed that the performance of students of section A is better than the students of section B in terms of good marks.
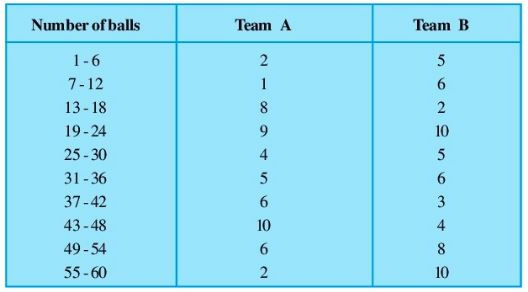
Question : 7: The runs scored by two teams A and B on the first 60 balls in a cricket match are given below:
Represent the data of both the teams on the same graph by frequency polygons.
[Hint: First make the class intervals continuous.]
Answer :
It can be observed that the class intervals of the given data are not continuous.
There is a gap of 1 in between them. Therefore, 1/2 = 0.5 has to be added to the upper class limits and 0.5 has to be subtracted from the lower class limits.
Also, class mark of each interval can be found by using the following formula.
Class mark = (Upper class limit + Lower class limit)/2
Continuous data with class mark of each class interval can be represented as follows.
By taking class marks on x-axis and runs scored on y-axis, a frequency polygon can be constructed as follows.
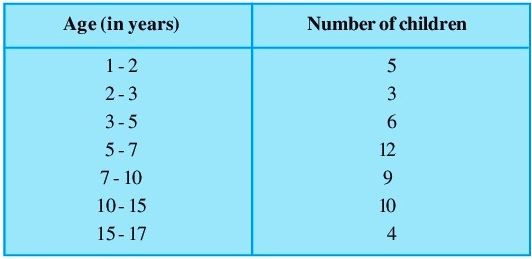
Question : 8: A random survey of the number of children of various age groups playing in park was found as follows:
Draw a histogram to represent the data above.
Answer :
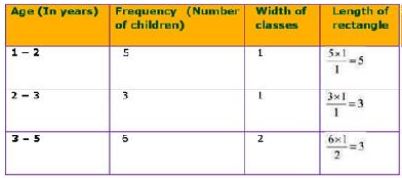
Here, it can be observed that the data has class intervals of varying width. The proportion of children per 1 year interval can be calculated as follows:
Taking the age of children on x-axis and proportion of children per 1 year interval on y-axis, the histogram can be drawn as follows:
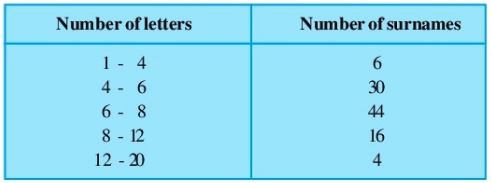
Question : 9: 100 surnames were randomly picked up from a local telephone directory and a frequency distribution of the number of letters in the English alphabet in the surnames was found as follows:
(i) Draw a histogram to depict the given information.
(ii)Write the class interval in which the maximum number of surname lie.
Answer :
(i) Here, it can be observed that the data has class intervals of varying width. The proportion of the number of surnames per 2 letters interval can be calculated as follows.
By taking the number of letters on x-axis and the proportion of the number of surnames per 2 letters interval on y-axis and choosing an appropriate scale
(1 unit = 4 students for y axis), the histogram can be constructed as follows.
(ii) The class interval in which the maximum number of surnames lies is 6 − 8 as it has 44 surnames in it i.e., the maximum for this data.