

= 6.25
(iii) Mean Deviation about Mean
a. Wheat
Wheat Production x |
|
9 | 6 |
10 | 5 |
10 | 5 |
12 | 3 |
15 | 0 |
16 | 1 |
18 | 3 |
19 | 4 |
21 | 6 |
25 | 10 |
|
|


b. Rice
Rice Production x |
|
12 | 6 |
12 | 6 |
12 | 6 |
15 | 3 |
18 | 0 |
18 | 0 |
22 | 4 |
23 | 5 |
29 | 11 |
34 | 16 |
|
|


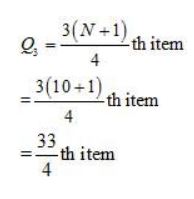
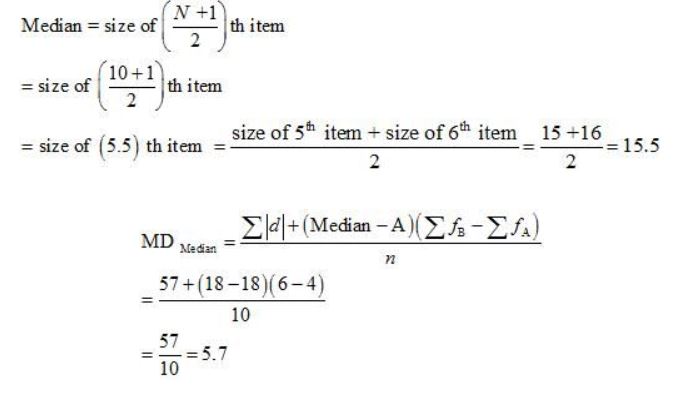
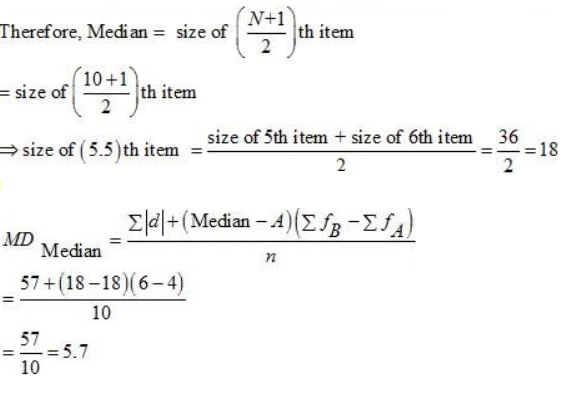
(iv) Mean Deviation about Median
a. Wheat
Production of Wheat x |
|
09 | 6 |
10 | 5 |
10 | 5 |
12 | 3 |
15 | 0 |
16 | 1 |
18 | 3 |
19 | 4 |
21 | 6 |
25 | 10 |
|


b. Rice
Production of rice | d = X—18 |
12 | 6 |
12 | 6 |
12 | 6 |
15 | 3 |
| 0 |
18 | 0 |
22 | 4 |
23 | 5 |
29 | 11 |
34 | 16 |
|
Since n is even
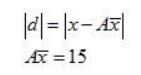
(v) Standard Deviation
a. Wheat
Reduction of Wheat x | Ax = 15 d= x — Ax | d2 |
9 | —6 | 36 |
10 | —5 | 25 |
10 | —5 | 25 |
12 | —3 | 9 |
15 | 0 | 0 |
16 | 1 | 1 |
18 | 3 | 9 |
19 | 4 | 16 |
21 | 6 | 36 |
25 | 10 | 100 |
|
|
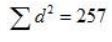
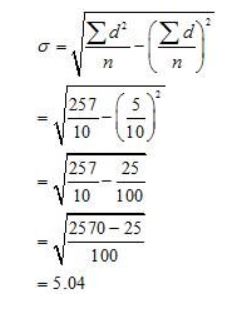
b. Rice
Production of rice x | Ax = 18 d = x — A x | d2 |
12 | —6 | 36 |
12 | —6 | 36 |
12 | —6 | 36 |
15 | —3 | 9 |
18 | 0 | 0 |
22 | 4 | 16 |
23 | 5 | 25 |
29 | 11 | 121 |
34 | 16 | 256 |
|
|

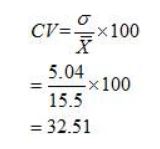
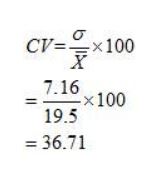

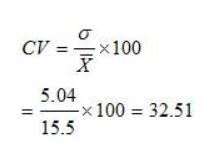
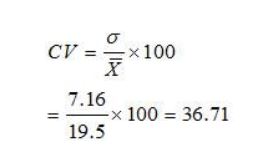
The coefficient of variation is more reliable than all other measures.
Question : 7:
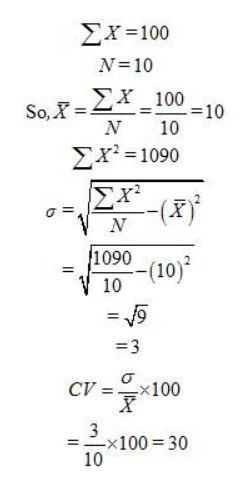
A batsman is to be selected for a cricket team. The choice is between X and Y on the basis of their scores in five previous tests which are:
| X | 25 | 85 | 40 | 80 | 120 |
| Y | 50 | 70 | 65 | 45 | 80 |
Which batsman should be selected if we want,
(i) a higher run getter, or
(ii) a more reliable batsman in the team?
Answer :
| Batsman X | ||
| X | X — X = x X — 70 | x2 |
| 25 | — 45 | 2025 |
| 85 | + 15 | 225 |
| — 30 | 900 | |
| 80 | 10 | 100 |
| 120 | 50 | 2500 |

| Batsman Y | ||
| Y | Y – Y = y | y2 |
| 50 | — 12 | 144 |
| 70 | 8 | 64 |
| 65 | 3 | 9 |
| 45 | — 17 | 289 |
| 80 | 18 | 324 |
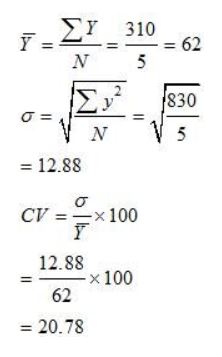
(i) Average of Batsman X is higher than that of Batsman Y, so he should be selected if we want to score higher run.
(ii) The Batsman X is more reliable than Batsman Y. This is because the coefficient of variation of Batsman X is higher than that of Batsman Y.
Page No 90:
Question 8:
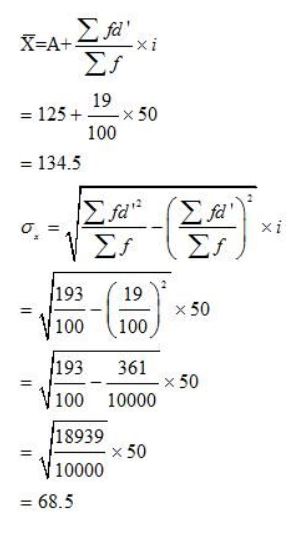
To check the quality of two brands of light bulbs, their life in burning hours was estimated as under for 100 bulbs of each brand.
| Life | No. of bulbs | ||
| (in hrs) | Brand A | Brand B | |
| 0 — 50 | 15 | 2 | |
| 50 — 100 | 20 | 8 | |
| 100 — 150 | 18 | 60 | |
| 150 — 200 | 25 | 25 | |
| 200 — 250 | 22 | 5 | |
| 100 | 100 | ||
(i) Which brand gives higher life?
(ii) Which brand is more dependable?
Answer :
| For Brand A | ||||||||
Life (in hours) | No. of bulbs | M | A = 125 | 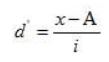 | d‘2 | fd‘ | fd‘2 | |
| f | x | X — A = d | ||||||
| 0 — 50 | 15 | 25 | — 100 | — 2 | 4 | — 30 | 60 | |
| 50 — 100 | 20 | 75 | — 50 | — 1 | 1 | — 20 | 20 | |
| 100 — 150 | 18 | 125 | 0 | 0 | 0 | 0 | 0 | |
| 150 — 200 | 25 | 175 | 50 | 1 | 1 | 25 | 25 | |
| 200 — 250 | 22 | 225 | 100 | 2 | 4 | 44 | 88 | |

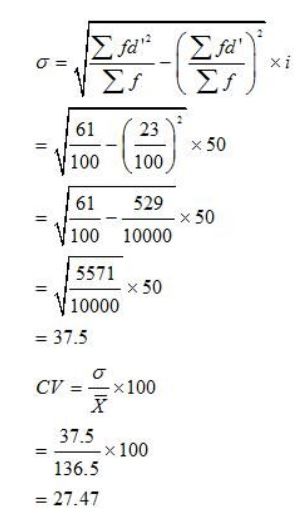
| For Brand B | ||||||||
| Life (in hrs) | No. of bulbs (f) | Mid value m | A = 125 | d’2 | fd’ | fd’2 | ||
| 0 — 50 | 2 | 25 | — 100 | — 2 | 4 | — 4 | 8 | |
| 50 — 100 | 8 | 75 | — 50 | — 1 | 1 | — 8 | 8 | |
| 100 — 150 | 60 | 125 | 0 | 0 | 0 | 0 | 0 | |
| 150 — 200 | 25 | 175 | 50 | 1 | 1 | 25 | 25 | |
| 200 — 250 | 5 | 225 | 100 | 2 | 4 | 10 | 20 | |


Initial Standard Deviation = Rs 40
So, New Standard Deviation = Rs 40 + 20
= Rs 60
Question : 11:
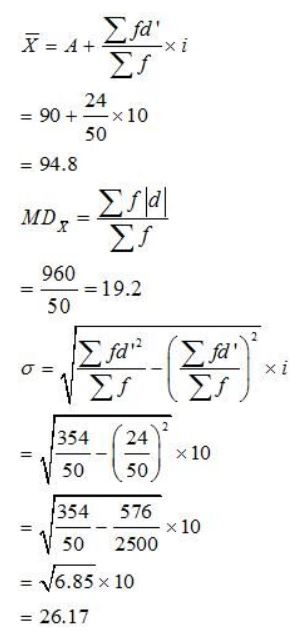
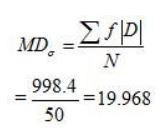
Calculate the Mean Deviation using mean and Standard Deviation for the following distribution.
Classes | Frequencies |
|---|---|
20 — 40 | 3 |
40 — 80 | 6 |
80 — 100 | 20 |
100 — 120 | 12 |
120 — 140 | 9 |
Total | 50 |
Answer :
Classes | Frequency | m | A = 90 d = X – A |
|
|
| fd’ | d’2 | fd’2 |
20 – 40 | 3 | 30 | – 60 | 60 | 180 | – 6 | – 18 | 36 | 108 |
40 – 80 | 6 | 60 | – 30 | 30 | 180 | – 3 | – 18 | 9 | 54 |
80 – 100 | 20 | 90 | 0 | 0 | 0 | 0 | 0 | 0 | 0 |
100 – 120 | 12 | 110 | 20 | 20 | 240 | 2 | 24 | 4 | 48 |
120 – 140 | 9 | 130 | 40 | 40 | 360 | 4 | 36 | 16 | 144 |
|
|
|
|