Page No 71:
Question : 1:
Which average would be suitable in the following cases?
(i) Average size of readymade garments.
(ii) Average intelligence of students in a class.
(iii) Average production in a factory per shift.
(iv) Average wage in an industrial concern.
(v) When the sum of absolute deviations from average is least.
(vi) When quantities of the variable are in ratios.
(vii) In case of open-ended frequency distribution.
Answer :
(i) The demand for the average size of any readymade garment is the maximum. As, the modal value represents the value with the highest frequency, so the number of the average size to be produced is given by the Modal value.
(ii) Median will be the best measure for calculating the average intelligence of students in a class. It is the value that divides the series into two equal parts. So, number of students below and above the average intelligence can easily be estimated by median.
(iii) It is advisable to use mean for calculating the average production in a factory per shift. The average production is best calculated by arithmetic mean.
(iv) Mean will be the most suitable measure. It is calculated by dividing the sum of wages of all the labour by the total number of labours in the industry.
(v) When the sum of absolute deviations from average is the least, then mean could be used to calculate the average. This is an important mathematical property of arithmetic mean. The algebraic sum of the deviations of a set of n values from A.M. is 0.
(vi) Median will be the most suitable measure in case the variables are in ratios. It is least affected by the extreme values.
(vii) In case of open ended frequency distribution, Median is the most suitable measure as it can be easily computed. Moreover, the median value can be estimated even in case of incomplete statistical series.
Question : 2(i):
The most suitable average for qualitative measurement is
(a) arithmetic mean
(b) median
(c) mode
(d) geometric mean
(e) none of the above
Answer :
Median is the most suitable average for qualitative measurement. This is because Median divides a series in two equal parts.
Page No 72:
Question : 2(ii):
Which average is affected most by the presence of extreme items?
(a) median
(b) mode
(c) arithmetic mean
(d) geometric mean
(e) harmonic mean
Answer :
Arithmetic mean is the most affected by the presence of extreme items. It is one of the prime demerits of the arithmetic mean. It is easily distorted by the extreme values, and also the value of arithmetic mean may not figure out at all in the series.
Question : 2(iii):
The algebraic sum of deviation of a set of n values from A.M. is
(a) n
(b) 0
(c) 1
(d) none of the above
Answer :
The algebraic sum of deviation of a set of n values from A.M. is zero. This is one of the mathematical properties of arithmetic mean.
Question : 3:
Comment whether the following statements are true or false.
(i) The sum of deviation of items from median is zero.
(ii) An average alone is not enough to compare series.
(iii) Arithmetic mean is a positional value.
(iv) Upper quartile is the lowest value of top 25% of items.
(v) Median is unduly affected by extreme observations.
Answer :
(i) The sum of deviation of items from median is zero. False
The statement is false. This mathematical property applies to the arithmetic mean that states that the sum of the deviation of all items from the mean is zero.
(ii) An average alone is not enough to compare series. True
An average indicates only the behaviour of a particular series. Therefore, in order to measure the extent of divergence of different items from the central tendency is measured by dispersion. So, average is not enough to compare the series.
(iii) Arithmetic mean is a positional value. False
This statement is false as mean is not a positional average, rather the statement holds true for median and mode. The calculation of median and modal values is based on the position of the items in the series, i.e. why these are also termed as positional averages.
(iv) Upper quartile is the lowest value of top 25% of items. True
The value that divides a statistical series into four equal parts, the end value of each part is called quartile. The third quartile or the upper quartile has 75 % of the items below it and 25 % of items above it,
(v) Median is unduly affected by extreme observations. False
This statement is true for Arithmetic mean. Arithmetic mean is most affected by the presence of extreme items. It is one of the prime demerits of the arithmetic mean. It is easily distorted by the extreme values, and also the value of arithmetic mean may not figure out at all in the series.
Question : 4:
If the arithmetic mean of the data given below is 28, find (a) the missing frequency, and (b) the median of the series:
| Profit per retail shop (in Rs) | 0 — 10 | 10 — 20 | 20 — 30 | 30 — 40 | 40 — 50 | 50 — 60 |
|---|---|---|---|---|---|---|
Number of retail shops | 12 | 18 | 27 | — | 17 | 6 |
Answer :
(i) Let the missing frequency be f1
Arithmetic Mean = 28
Profit per Retail Shop (in Rs) | No of Retail Shops | Mid Value | |
|---|---|---|---|
Class Interval | (f) | (m) | fm |
0 – 10 | 12 | 5 | 60 |
10 – 20 | 18 | 15 | 270 |
20 – 30 | 27 | 25 | 675 |
30 – 40 | f1 | 35 | 35f1 |
40 – 50 | 17 | 45 | 765 |
50 – 60 | 6 | 55 | 330 |
|
|


or, 2240 + 28f1 = 2100 + 35f1
or, 2240 – 2100 = 35f1 – 28f1
or, 140 = 7f1
f1 = 20
(ii)
| Class Interval | Frequency(f) | Cumulative Frequency(CF) |
|---|---|---|
0 – 10 | 12 | 12 |
10 – 20 | 18 | 30 |
20 – 30 | 27 | 57 |
30 – 40 | 20 | 77 |
40 – 50 | 17 | 94 |
50 – 60 | 6 | 100 |
Total |
|


Question : 5:
The following table gives the daily income of ten workers in a factory. Find the arithmetic mean.
| Workers | A | B | C | D | E | F | G | H | I | J |
|---|---|---|---|---|---|---|---|---|---|---|
Daily Income (in Rs) | 120 | 150 | 180 | 200 | 250 | 300 | 220 | 350 | 370 | 260 |
Answer :
| Workers | Daily Income (in Rs) (X) |
|---|---|
A | 120 |
B | 150 |
C | 180 |
D | 200 |
E | 250 |
F | 300 |
G | 220 |
H | 350 |
I | 370 |
J | 260 |
Total |
|

N = 10
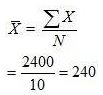
Arithmetic mean = Rs 240
Question : 6:
Following information pertains to the daily income of 150 families. Calculate the arithmetic mean.
| Income (in Rs) | Number of families |
|---|---|
More than 75 | 150 |
More than 85 | 140 |
More than 95 | 115 |
More than 105 | 95 |
More than 115 | 70 |
More than 125 | 60 |
More than 135 | 40 |
More than 145 | 25 |
Answer :
| Income | No. of families | Frequency | Mid Value | fm |
|---|---|---|---|---|
Class Interval | (CF) | (f) | (m) | |
75 — 85 | 150 | 150 — 140 = 10 | 80 | 800 |
85 — 95 | 140 | 140 — 115 = 25 | 90 | 2250 |
95 — 105 | 115 | 115 — 95 = 20 | 100 | 2000 |
105 — 115 | 95 | 95 — 70 = 25 | 110 | 2750 |
115 — 125 | 70 | 70 — 60 = 10 | 120 | 1200 |
125 — 135 | 60 | 60 — 40 = 20 | 130 | 2600 |
135 — 145 | 40 | 40 — 25 = 15 | 140 | 2100 |
145 — 155 | 25 | 25 | 150 | 3750 |
Total |
|
|

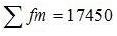
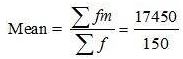
= Rs 116.33
Page No 73:
Question : 7:
The size of land holdings of 380 families in a village is given below. Find the median size of land holdings.
| Size of Land Holdings (in acres) | Less than 100 | 100 — 200 | 200 — 300 | 300 — 400 | 400 and above |
|---|---|---|---|---|---|
Number of families | 40 | 89 | 148 | 64 | 39 |
Answer :
| Size of Land Holdings Class Interval | No. of Families (f) | Cumulative Frequency (CF) |
|---|---|---|
0 – 100 | 40 | 40 |
100 – 200 | 89 | 129 |
200 – 300 | 148 | 277 |
300 – 400 | 64 | 341 |
400 – 500 | 39 | 380 |
Total |
|

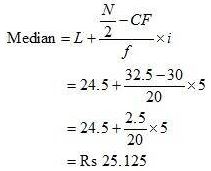
So, the Median class = Size of  item = 190th item
190th item lies in the 129th cumulative frequency and the corresponding class interval is 200 – 300.
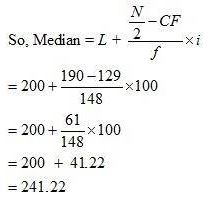
Median size of land holdings = 241.22 acres
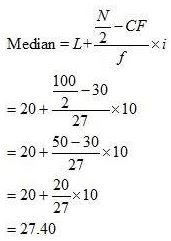
Question : 8:
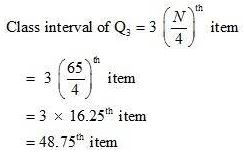
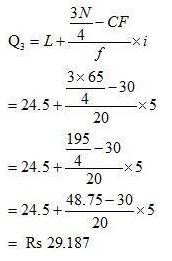
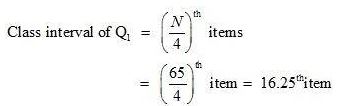
The following series relates to the daily income of workers employed in a firm. Compute (a) highest income of lowest 50% workers (b) minimum income earned by the top 25% workers and (c) maximum income earned by lowest 25% workers.
Daily Income (in Rs) | 10 – 14 | 15 – 19 | 20 – 24 | 25 – 29 | 30 – 34 | 35 – 39 |
Number of workers | 5 | 10 | 15 | 20 | 10 | 5 |
(Hint: Compute median, lower quartile and upper quartile)
Answer :
| Daily Income (in Rs) Class Interval | No. of Workers (f) | Cumulative frequency (CF) |
|---|---|---|
9.5 – 14.5 | 5 | 5 |
14.5 – 19.5 | 10 | 15 |
19.5 – 24.5 | 15 | 30 |
24.5 – 29.5 | 20 | 50 |
29.5 – 34.5 | 10 | 60 |
34.5 – 39.5 | 5 | 65 |
|

(a) Highest income of lowest 50% workers

Question : 9:
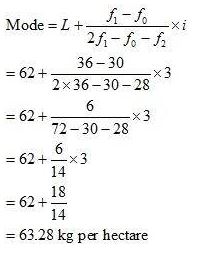
The following table gives production yield in kg. per hectare of wheat of 150 farms in a village. Calculate the mean, median and mode values.
| Production yield (kg. per hectare) | 50 — 53 | 53 — 56 | 56 — 59 | 59 — 62 | 62 — 65 | 65 — 68 | 68 — 71 | 71 — 74 | 74 — 77 |
|---|---|---|---|---|---|---|---|---|---|
| Number of farms | 3 | 8 | 14 | 30 | 36 | 28 | 16 | 10 | 5 |
Answer :
(i) Mean
| Production Yield | No. of farms | Mid value | A = 63.5 |  |  |
|---|---|---|---|---|---|
50 – 53 | 3 | 51.5 | –12 | –4 | –12 |
53 – 56 | 8 | 54.5 | –9 | –3 | –24 |
56 – 59 | 14 | 57.5 | –6 | –2 | –28 |
59 – 62 | 30 | 60.5 | –3 | –1 | –30 |
62 – 65 | 36 | 63.5 | 0 | 0 | 0 |
65 – 68 | 28 | 66.5 | +3 | +1 | 28 |
68 – 71 | 16 | 69.5 | +6 | +2 | 32 |
71 – 74 | 10 | 72.5 | +9 | +3 | 30 |
74 – 77 | 5 | 75.5 | +12 | +4 | 20 |
Total |
|
|


= 63.5 + 0.32
= 63.82 kg per hectare
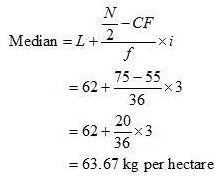
(ii) Median
| Class Interval | Frequency (f) | CF |
|---|---|---|
50 – 53 | 3 | 3 |
53 – 56 | 8 | 11 |
56 – 59 | 14 | 25 |
59 – 62 | 30 | 55 |
62 – 65 | 36 | 91 |
65 – 68 | 28 | 119 |
68 – 71 | 16 | 135 |
71 – 74 | 10 | 145 |
74 – 77 | 5 | 150 |
Total |
|